

CoreLogic Home Value Index Report - October - Key Points

CoreLogic Home Value Index (HVI) Report is out, and it has recorded six months of falls for Australia’s residential property market. Here are our six key points below;
National Decline in HVI Has Slowed.
South Australia and Adelaide are showing resilience to the recent interest rate rises as housing affordability becomes the main driver of growth in the region.
CoreLogic - Tim Lawless, Executive, Research Director, Asia-Pacific, shares his insight on the housing market and what stage of the cycle we are currently in.
Stock is still -25.5% lower than in 2021 and -19% below the five-year average. The total advertised listings trend is relatively firm, tracking -5.0% below levels a year ago and -18.2% below the previous five-year average.
October, capital city home sales were -16.6% lower than a year ago and +3.8% above the previous five-year average.
Investors have seen the highest level of gross yield in Capital city (3.43%) since November 2020, recovering by 47 basis points from the February 2022 record low.
The falls in HVI eased over the past two months across Sydney -1.3% and Melbourne -0.8% over the past three months. Brisbane -2.0% has the most rapid decline in home value after the dizzying increase in HVI during the pandemic. Nationally the decline has slowed consecutively over the past three months;
-1.6% drop in August
-1.4% in September
-1.1% in October.
Adelaide and Regional South Australia are seeing the most resistance to the recent interest rate rises, with Adelaide down -0.3% for the month, -0.6% for the past three months and still +16.5%. Regional South Australia remains positive for the month, narrowly holding on and the only sector to record a +0.1% increase in HVI, +0.8% for the past three months and +20.4% for the past 12 months. The market has flattened in this region.
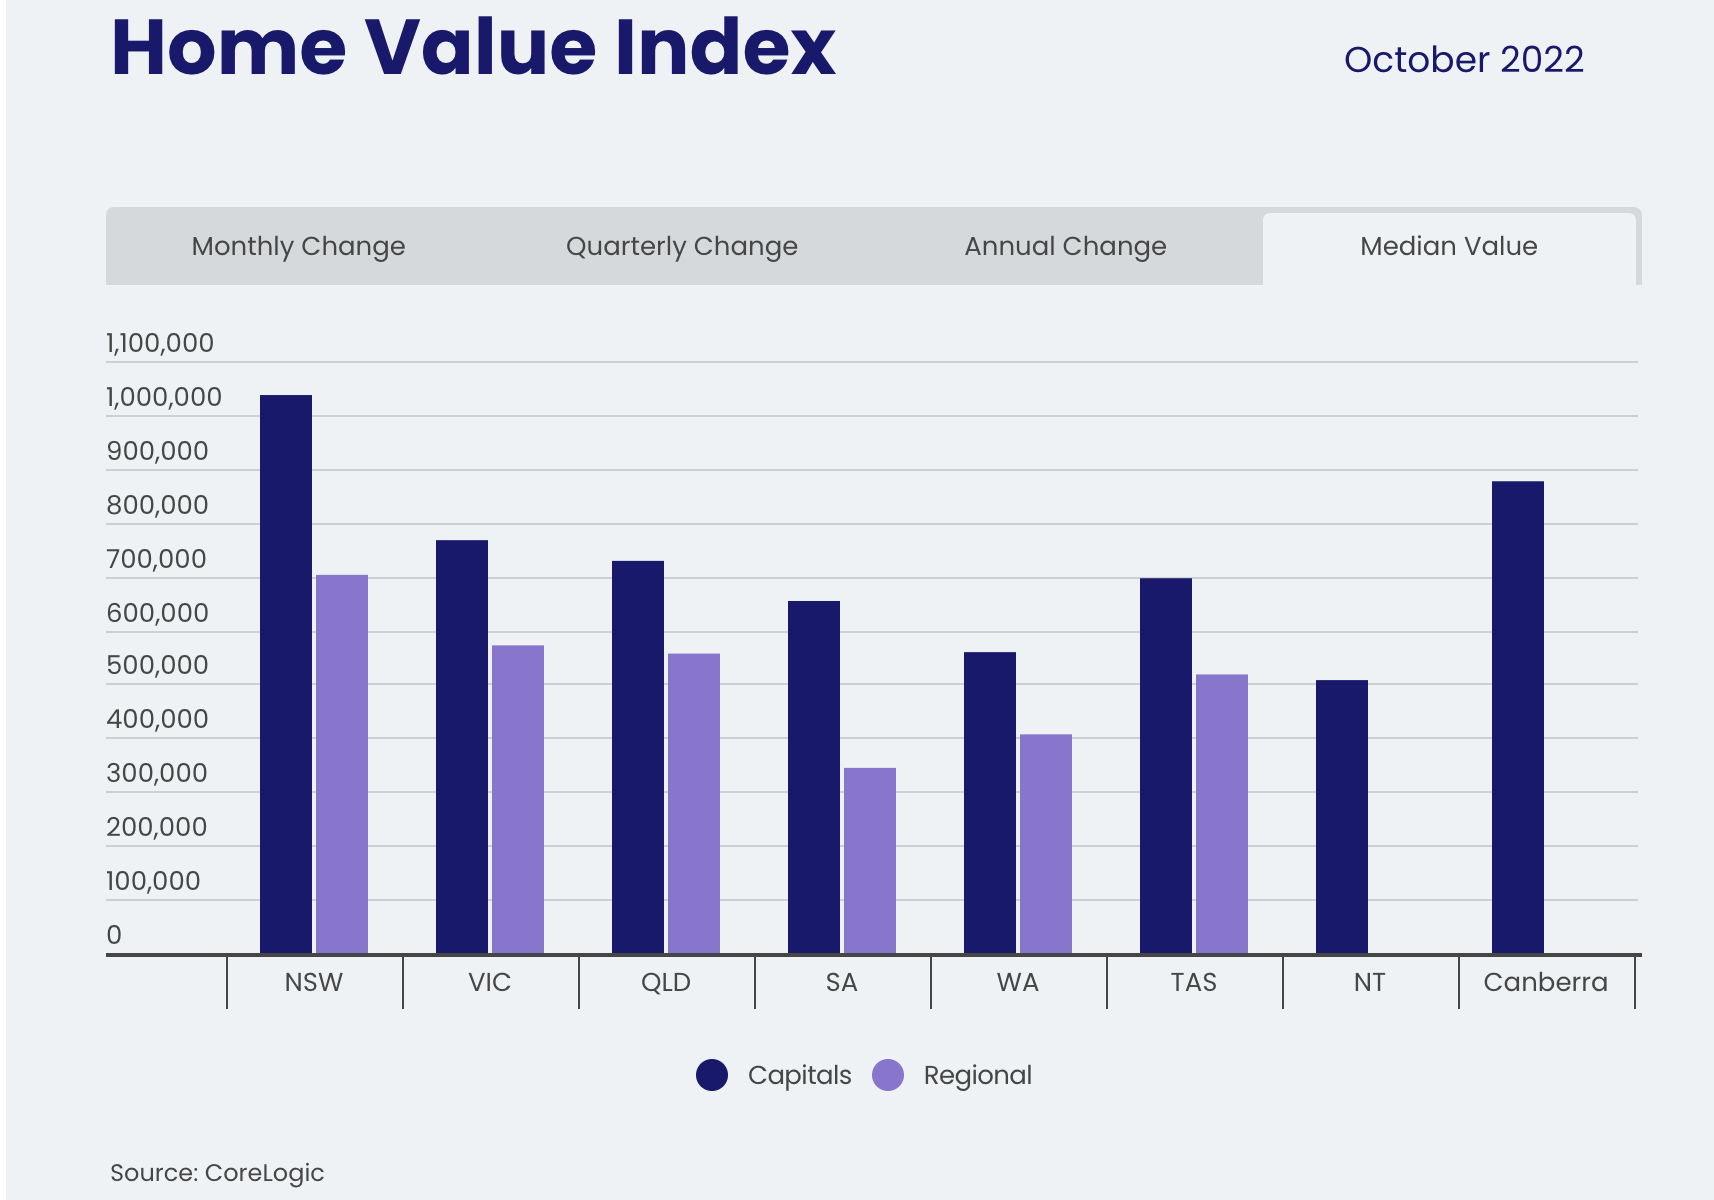
What are the Median Dwelling Values for each location?
Sydney - $1,036,727, REG NSW - $702,629
Melbourne - $767,117, REG VIC - $571,665
Brisbane - $728,615, REG QLD - $556,313
Adelaide - $654,079, REG SA - $343,977
Perth - $559,043, REG WA - $406,303
Hobart - $696,334, REG TAS - $517,586
Darwin - $507,081 - NA
Canberra - $876,567 - NA

Are we looking at the bottom of the housing market?
“Despite the easing in the pace of decline, with Australian borrowers facing the double whammy of further interest rate hikes along with persistently high and rising inflation, there is a genuine risk we could see the rate of decline re-accelerate as interest rates rise further and household balance sheets become more thinly stretched”


What is preventing the rapid decline in the housing market that was predicted by some experts?
“To-date, the housing downturn has remained orderly, at least in the
context of the significant upswing in values. This is supported by a
below-average flow of new listings that is keeping overall inventory
levels contained. There’s also tight labour market conditions, an
accrual of borrower savings and a larger than normal cohort of fixed
interest rate borrowers, who have so far been insulated from the rapid rise in interest rates”

Even though we’ve seen a drop of -10.2% in Sydney, 6.4% Melbourne with a fall of 6.2% in Brisbane, we are still well above the pre-covid levels.
More affordable capital cities, Darwin, Perth, and Adelaide, remain resilient to the recent interest rate rises.
Sydney Peak +27.7% Drop -10.2%
Melbourne +17.3% Drop -6.4%
Brisbane +42.7% Drop -6.2%
Adelaide +44.7% Drop -0.6%
Perth +25.9% Drop - 0.7%
Hobart +37.7% Drop - 5.7%
Darwin +31.1% Drop -0.9%
ACT + 38.3% Drop 5.4%
Housing affordability and the ability to work remotely in the post covid era are contributing to the growth in demand for regional areas and the reason there is less of a decline in the HVI since interest rates have increased since May 2022.
REG NSW +47.6% Drop - 6.1%
REG VIC + 35.0% Drop -4.5%
REG QLD + 42.7% Drop - 4.7%
REG SA + 43.8% - AT PEAK
REG WA + 31.0% - Drop -0.3%
REG TAS + 51.0% Drop - 4.6%

Is the housing stock returning to the market?
CoreLogic recorded the New Listings and overall listings for the four weeks of October. The traditional spring selling season remains -25.5% lower than 2021 and -19% below the five-year average. The trend in total advertised listings is holding relatively firm, tracking -5.0% below levels a year ago and -18.2% below the previous five-year average.
“Although we are now seeing a late spring response to freshly advertised supply, every capital city except Darwin is recording a lower than average flow of new listings added to the market over the past four weeks. The low number of freshly advertised properties is probably helping to contain price falls to some extent. So far we haven’t seen any evidence of panicked selling or forced sales”

Are there still buyers wanting to purchase houses?
The estimated number of home sales has held reasonably firm through the first two months of spring. However, based on modelled sales over the three months ending October, capital city home sales were -16.6% lower than a year ago and +3.8% above the previous five-year average. What we are seeing is a correction.
“The number of home sales is well down from the highs of late last year, however the fact that sales activity is still above the five-year average over the past three months reflects a base level of demand remains for housing. Housing finance data shows subsequent buyers, such as upgraders, downsizers or movers, have been the most resilient sector of the market since interest rates started to rise. As interest rates rise further, it’s likely sales activity will also trend lower as borrowing capacity is reduced.”
How are the Australian Rental Markets performing for October 2022?

Nationally rents rose another 0.6% in October, led by a 1.1% rise in unit rents, while house rents increased by 0.5%.
The inflationary squeeze has increased popularity for medium to high-density styles of accommodation can probably be attributed to rental demand transitioning towards more affordable rental options such as units, along with the added demand from overseas migration, which tends to favour inner city unit rents, especially in Melbourne and Sydney. Melbourne and Sydney lead the way, as they are traditionally the first choice for international arrivals when immigrating to Australia, recorded the highest annual rental appreciation for units, with rents up 13.7% and 13.4%, respectively, over the past 12 months.
What is the rate of rental growth nationally for the quarter?
Rental growth has slowed, with the rolling quarterly rate of national rental growth dropping from 3.0% over the three months ending May 2022 to 2.1% over the most recent three-month period
Will rental yields continue to grow at this rapid pace?
“A gradual slowdown in rental growth in the face of low vacancy rates
could be an early sign that renters are reaching an affordability
ceiling. Since the onset of COVID, capital city rents have risen 17.7%
and regional rents are up 25.5%. Although rents are likely to continue
to rise, it’s likely renters will be progressively seeking rental options
across the medium to high density sector, where renting is cheaper,
or maximising the number of people in the tenancy in an effort to
spread higher rental costs across a larger household,”
It is not all doom and gloom. Investors have seen the highest level of gross yield in Capital city (3.43%) since November 2020, recovering by 47 basis points from the February 2022 record low. We saw a 57 basis point rise in unit yields, whereas house yields rose by a respectable 43 basis points. Despite rising by a more modest 34 basis points since the April low, regional yields are substantially higher than gross yields across the combined capitals at 4.4% for houses and 3.4% for units, respectively.
To read the full CoreLogic HVI Report for October click, on the link below;